Last active
November 22, 2021 21:40
-
-
Save dirkseidensticker/ce98c6adfe16d5e4590e95c587ea0432 to your computer and use it in GitHub Desktop.
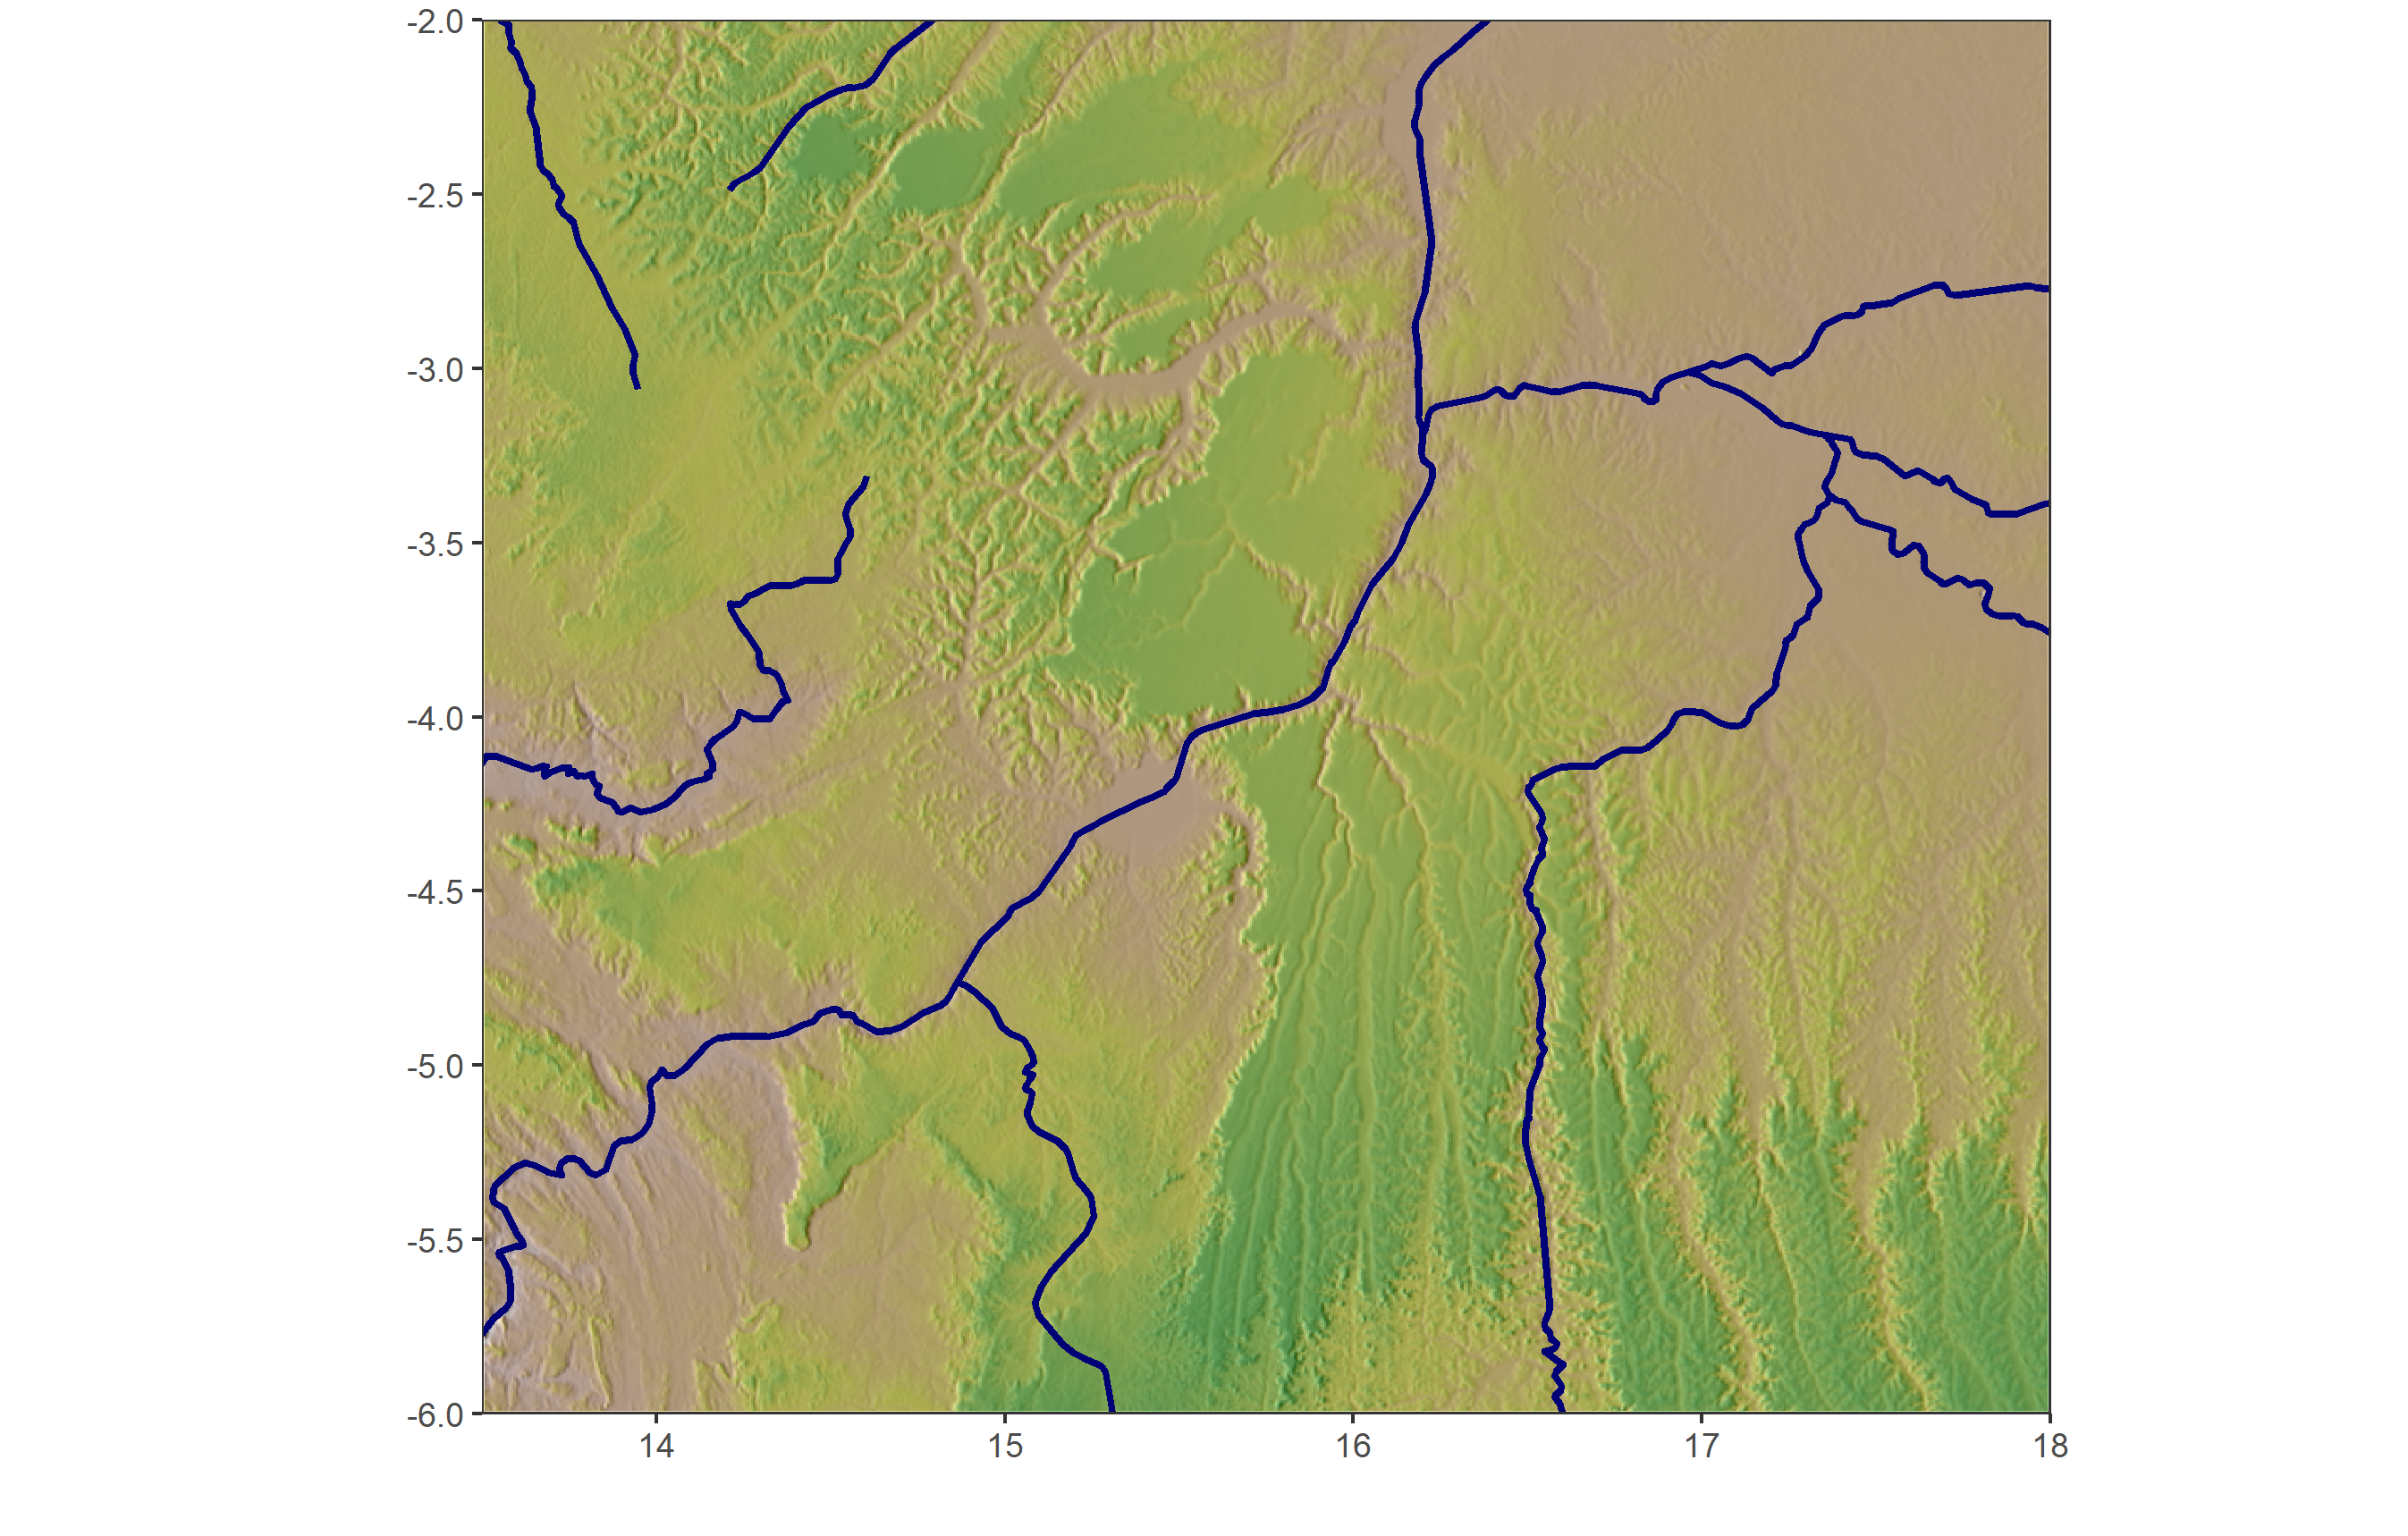
hillshaded maps with R/ggplot + ggnewscale
This file contains hidden or bidirectional Unicode text that may be interpreted or compiled differently than what appears below. To review, open the file in an editor that reveals hidden Unicode characters.
Learn more about bidirectional Unicode characters
| library(elevatr) | |
| library(ggplot2) | |
| library(raster) | |
| library(rgdal) | |
| library(rnaturalearth) | |
| library(sp) | |
| library(sf) | |
| #library(devtools) | |
| #devtools::install_github("eliocamp/ggnewscale") | |
| library(ggnewscale) | |
| # setting up boundig box | |
| locations <- data.frame(X1 = c(13.5, 18), | |
| X2 = c(-2, -6)) | |
| # get gem | |
| dem <- get_elev_raster(locations = locations, prj = sf::st_crs(4326), z = 7, clip = "bbox") | |
| # create slope and hillshade | |
| slope = terrain(dem, opt='slope') | |
| aspect = terrain(dem, opt='aspect') | |
| hill = hillShade(slope, aspect, 40, 270) | |
| dem_spdf <- as(dem, "SpatialPixelsDataFrame") | |
| dem_spdf <- as.data.frame(dem_spdf) | |
| colnames(dem_spdf) <- c("value", "x", "y") | |
| hill_spdf <- as(hill, "SpatialPixelsDataFrame") | |
| hill_spdf <- as.data.frame(hill_spdf) | |
| colnames(hill_spdf) <- c("value", "x", "y") | |
| # get rivers + lakes | |
| rivers10 <- ne_download(scale = 10, type = 'rivers_lake_centerlines', category = 'physical') | |
| lakes10 <- ne_download(scale = 10, type = 'lakes', category = 'physical') | |
| # plot with different color scales | |
| ggplot() + | |
| geom_tile(data = hill_spdf, aes(x = x, y = y, fill = value)) + | |
| scale_fill_gradient(low = "black", high = "white") + | |
| new_scale_fill() + | |
| geom_tile(data = dem_spdf, aes(x = x, y = y, fill = value), alpha=0.4) + | |
| geom_path(data = rivers10, | |
| aes(long, lat, group = group), size = 1, color = '#000077') + | |
| geom_polygon(data = lakes10, | |
| aes(long, lat, group = group), size = 1, fill = '#000077', color = NA) + | |
| scale_fill_gradientn(colours = rev(terrain.colors(10))) + | |
| scale_x_continuous("", expand = c(0, 0)) + | |
| scale_y_continuous("", expand = c(0, 0)) + | |
| coord_sf(xlim = c(locations[1,1], locations[2,1]), | |
| ylim = c(locations[2,2], locations[1,2])) + | |
| theme_bw() + | |
| theme(legend.position="none") | |
| ggsave("dem.png") |
Author
dirkseidensticker
commented
Feb 17, 2019
Hi, "get_elev_raster(locations = bb.box, prj = sf::st_crs(4326), z = 7, clip = "bbox")" the get_elev_raster function needs to create an account ? How the raster is downloaded ? I'm blocked here.
Author
@vladamihaesei many thanks for reaching out. I had issues with getting the dem a few days ago and needed to update how the info on the bounding box is given to the get_elev_raster as my old approach was suddenly not working anymore. You do not need any account. What works (as well) is to give the xmin/xmax and ymin/ymax as a simple dataframe (see lines 13-18). Please also note that I changed the coord_sf statement and added the sf library. In any case, please reach out if you run into any more troubles.
Great, it's works. Thank you.
Sign up for free
to join this conversation on GitHub.
Already have an account?
Sign in to comment