Last active
August 21, 2017 18:51
-
-
Save RichStone/18d351bb05427031ee3bec0533307c01 to your computer and use it in GitHub Desktop.
This is an exploratory jupyter notebook which guides a beginner through scraping and statistical analysis of historical weather data to compare Berlin's and Moscow's weather.
This file contains hidden or bidirectional Unicode text that may be interpreted or compiled differently than what appears below. To review, open the file in an editor that reveals hidden Unicode characters.
Learn more about bidirectional Unicode characters
| { | |
| "cells": [ | |
| { | |
| "cell_type": "markdown", | |
| "metadata": { | |
| "collapsed": true | |
| }, | |
| "source": [ | |
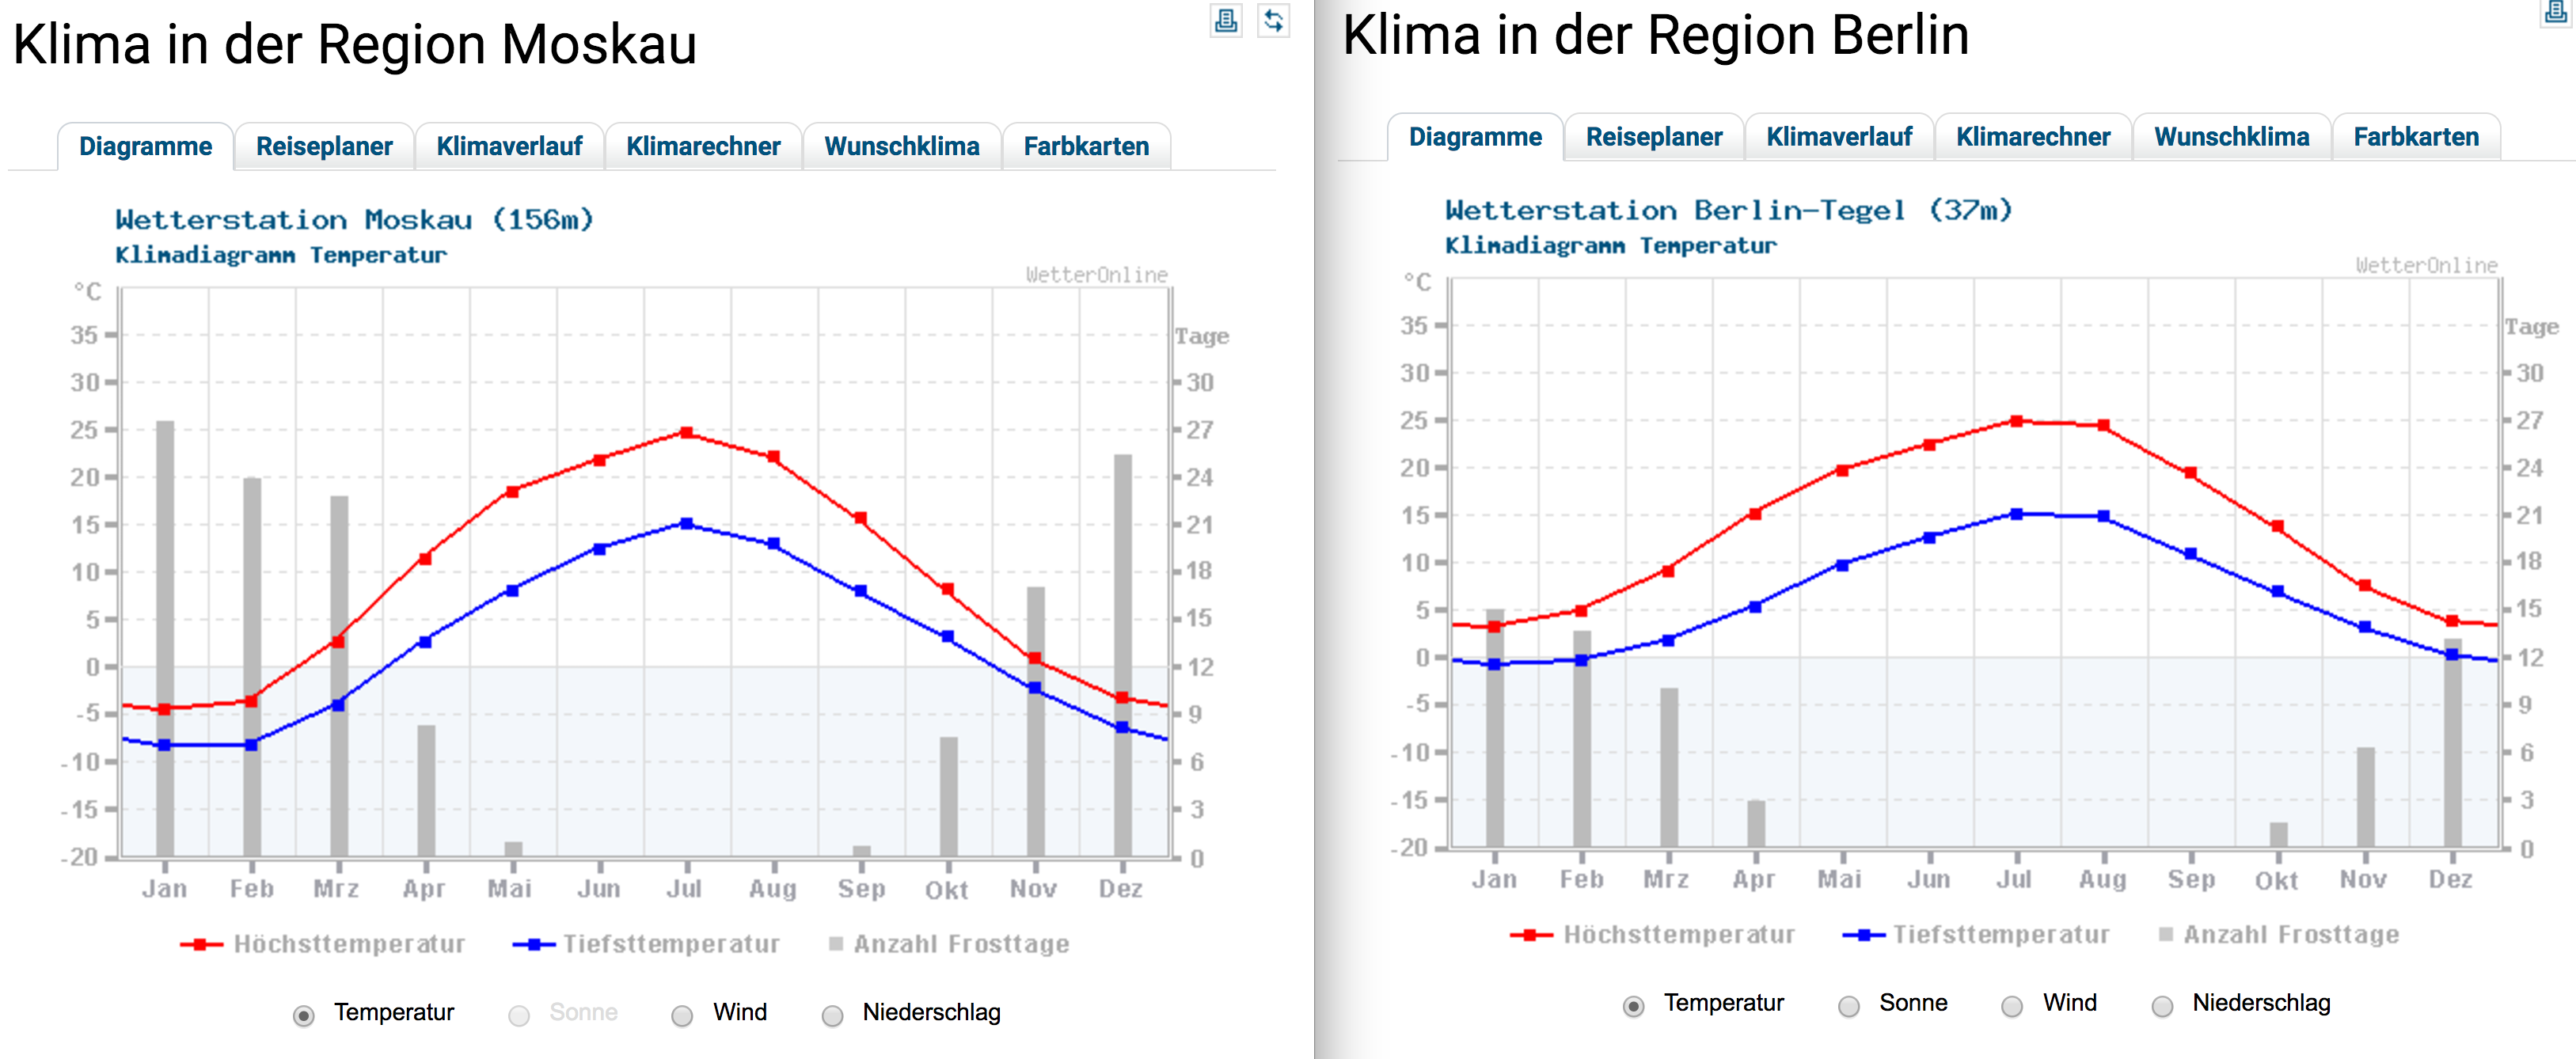
| "# Hypothesis: \n", | |
| "This hypothesis was issued by the \"Statistical Institute Alina Steinmetz\" (my wife) and is being preached since we moved from Moscow to Berlin many years ago (in 2011). It is time to examine the truthfulness of this hypothesis:\n", | |
| "\n", | |
| " \"Berlin summers are most of the time much colder than in Moscow. Berlin is much more mild over the year but the summers in Moscow are hotter.\"\n", | |
| " \n", | |
| "# First Try\n", | |
| "When searching for data I encountered that there are of course a lot of statistics out there already and decided that it wouldn't make sense for me to work with something that was visualized and depicted 1000 times before. So I just got 3 comparing statistics from the German weather website http://www.wetteronline.de/klima-temperatur/berlin \n", | |
| ", showed them to my wife and explained that when comparing the graphs she will see that...\n", | |
| "<br>" | |
| ] | |
| }, | |
| { | |
| "cell_type": "markdown", | |
| "metadata": {}, | |
| "source": [ | |
| "### ... Berlin is slightly warmer in June and August:" | |
| ] | |
| }, | |
| { | |
| "cell_type": "markdown", | |
| "metadata": {}, | |
| "source": [ | |
| "" | |
| ] | |
| }, | |
| { | |
| "cell_type": "markdown", | |
| "metadata": {}, | |
| "source": [ | |
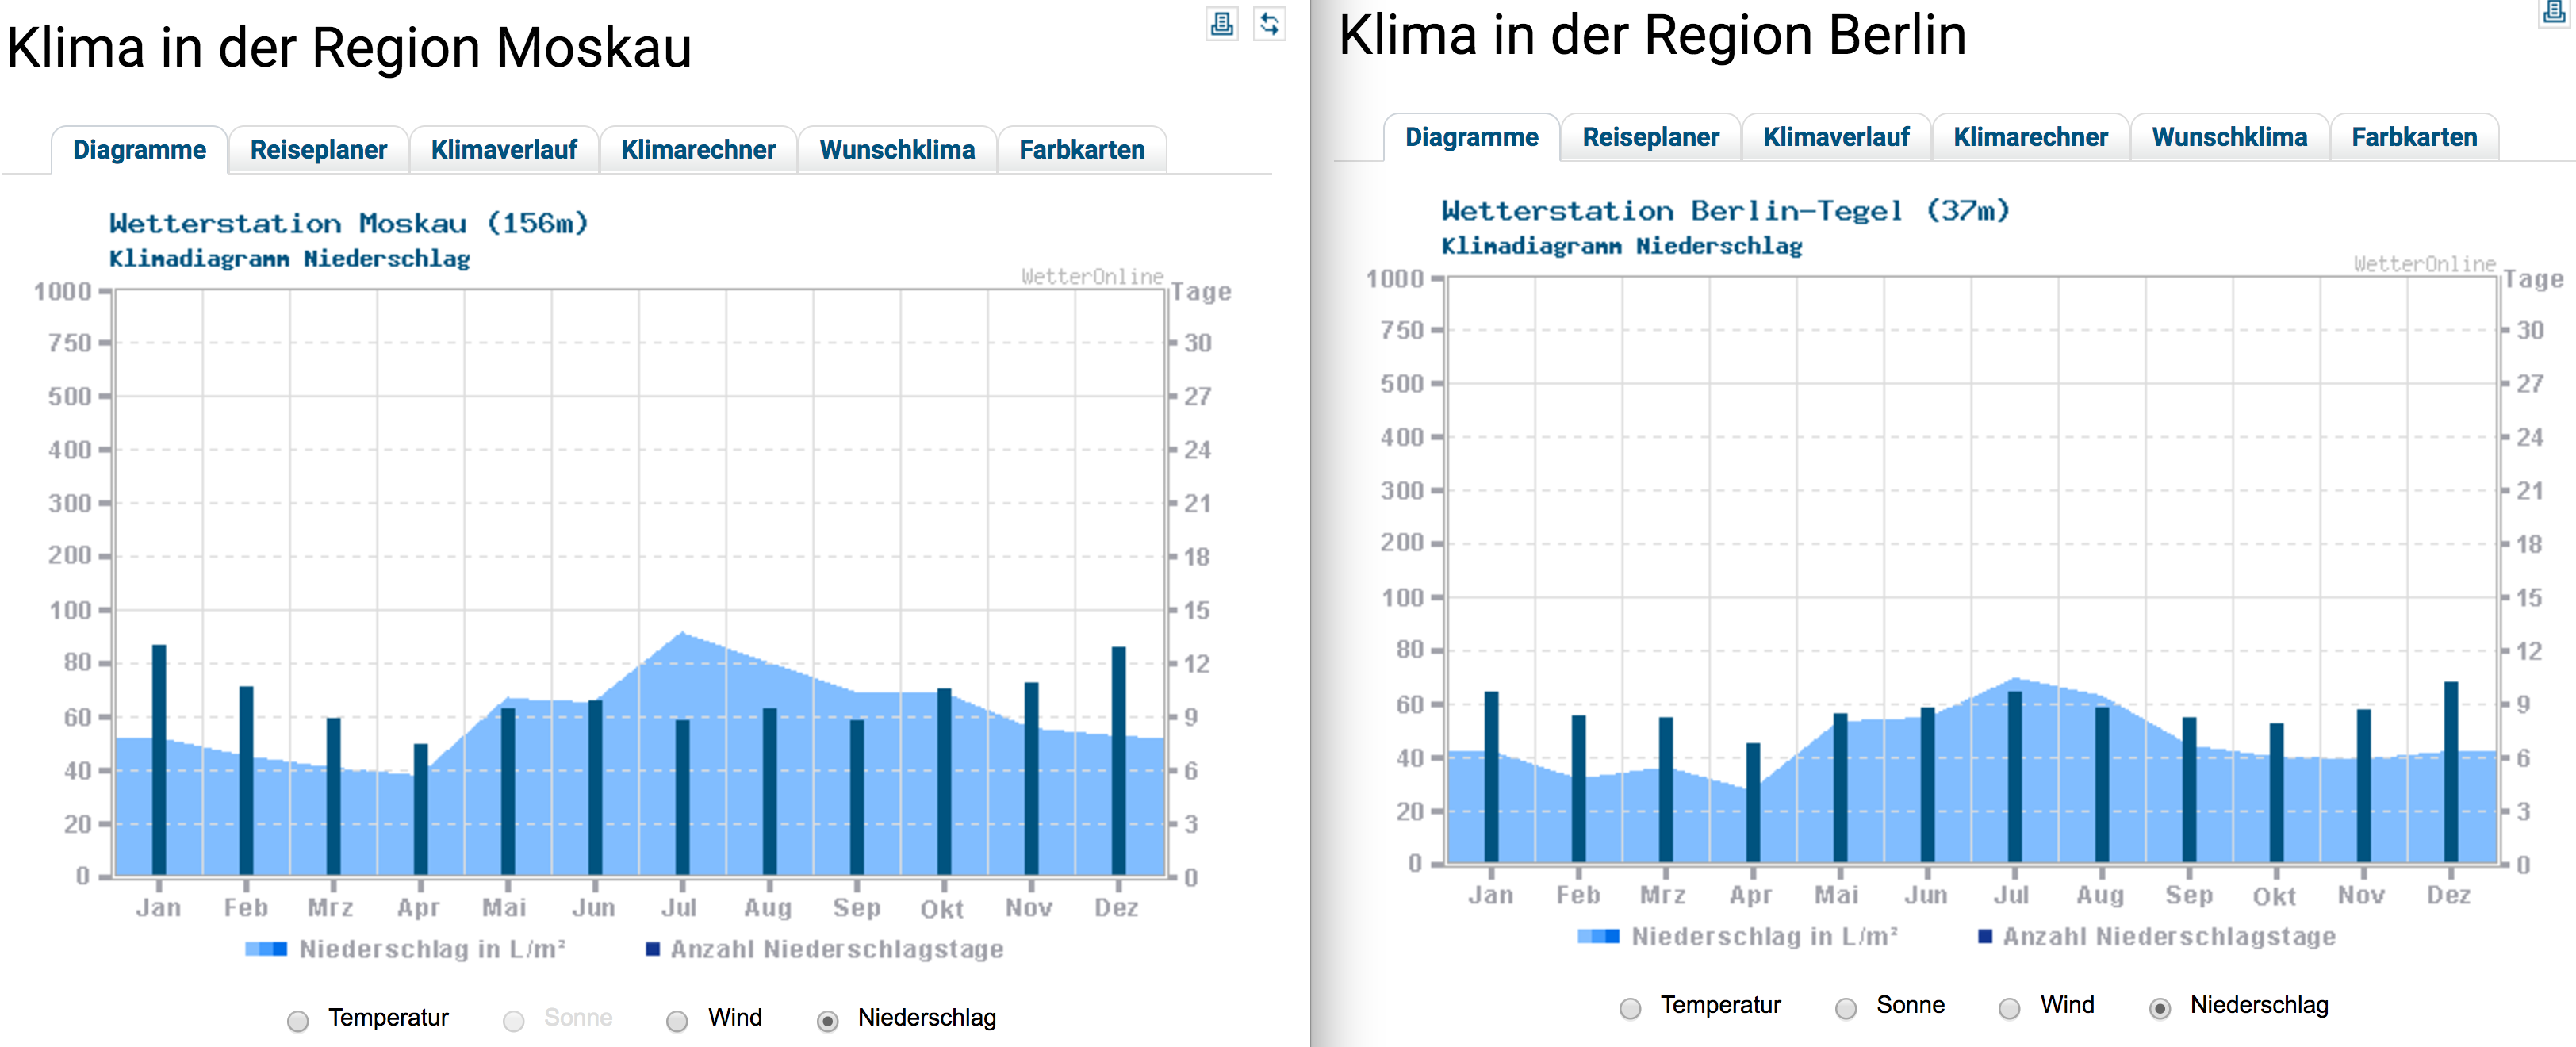
| "### ... Berlin is less rainy:" | |
| ] | |
| }, | |
| { | |
| "cell_type": "markdown", | |
| "metadata": { | |
| "collapsed": false | |
| }, | |
| "source": [ | |
| "" | |
| ] | |
| }, | |
| { | |
| "cell_type": "markdown", | |
| "metadata": {}, | |
| "source": [ | |
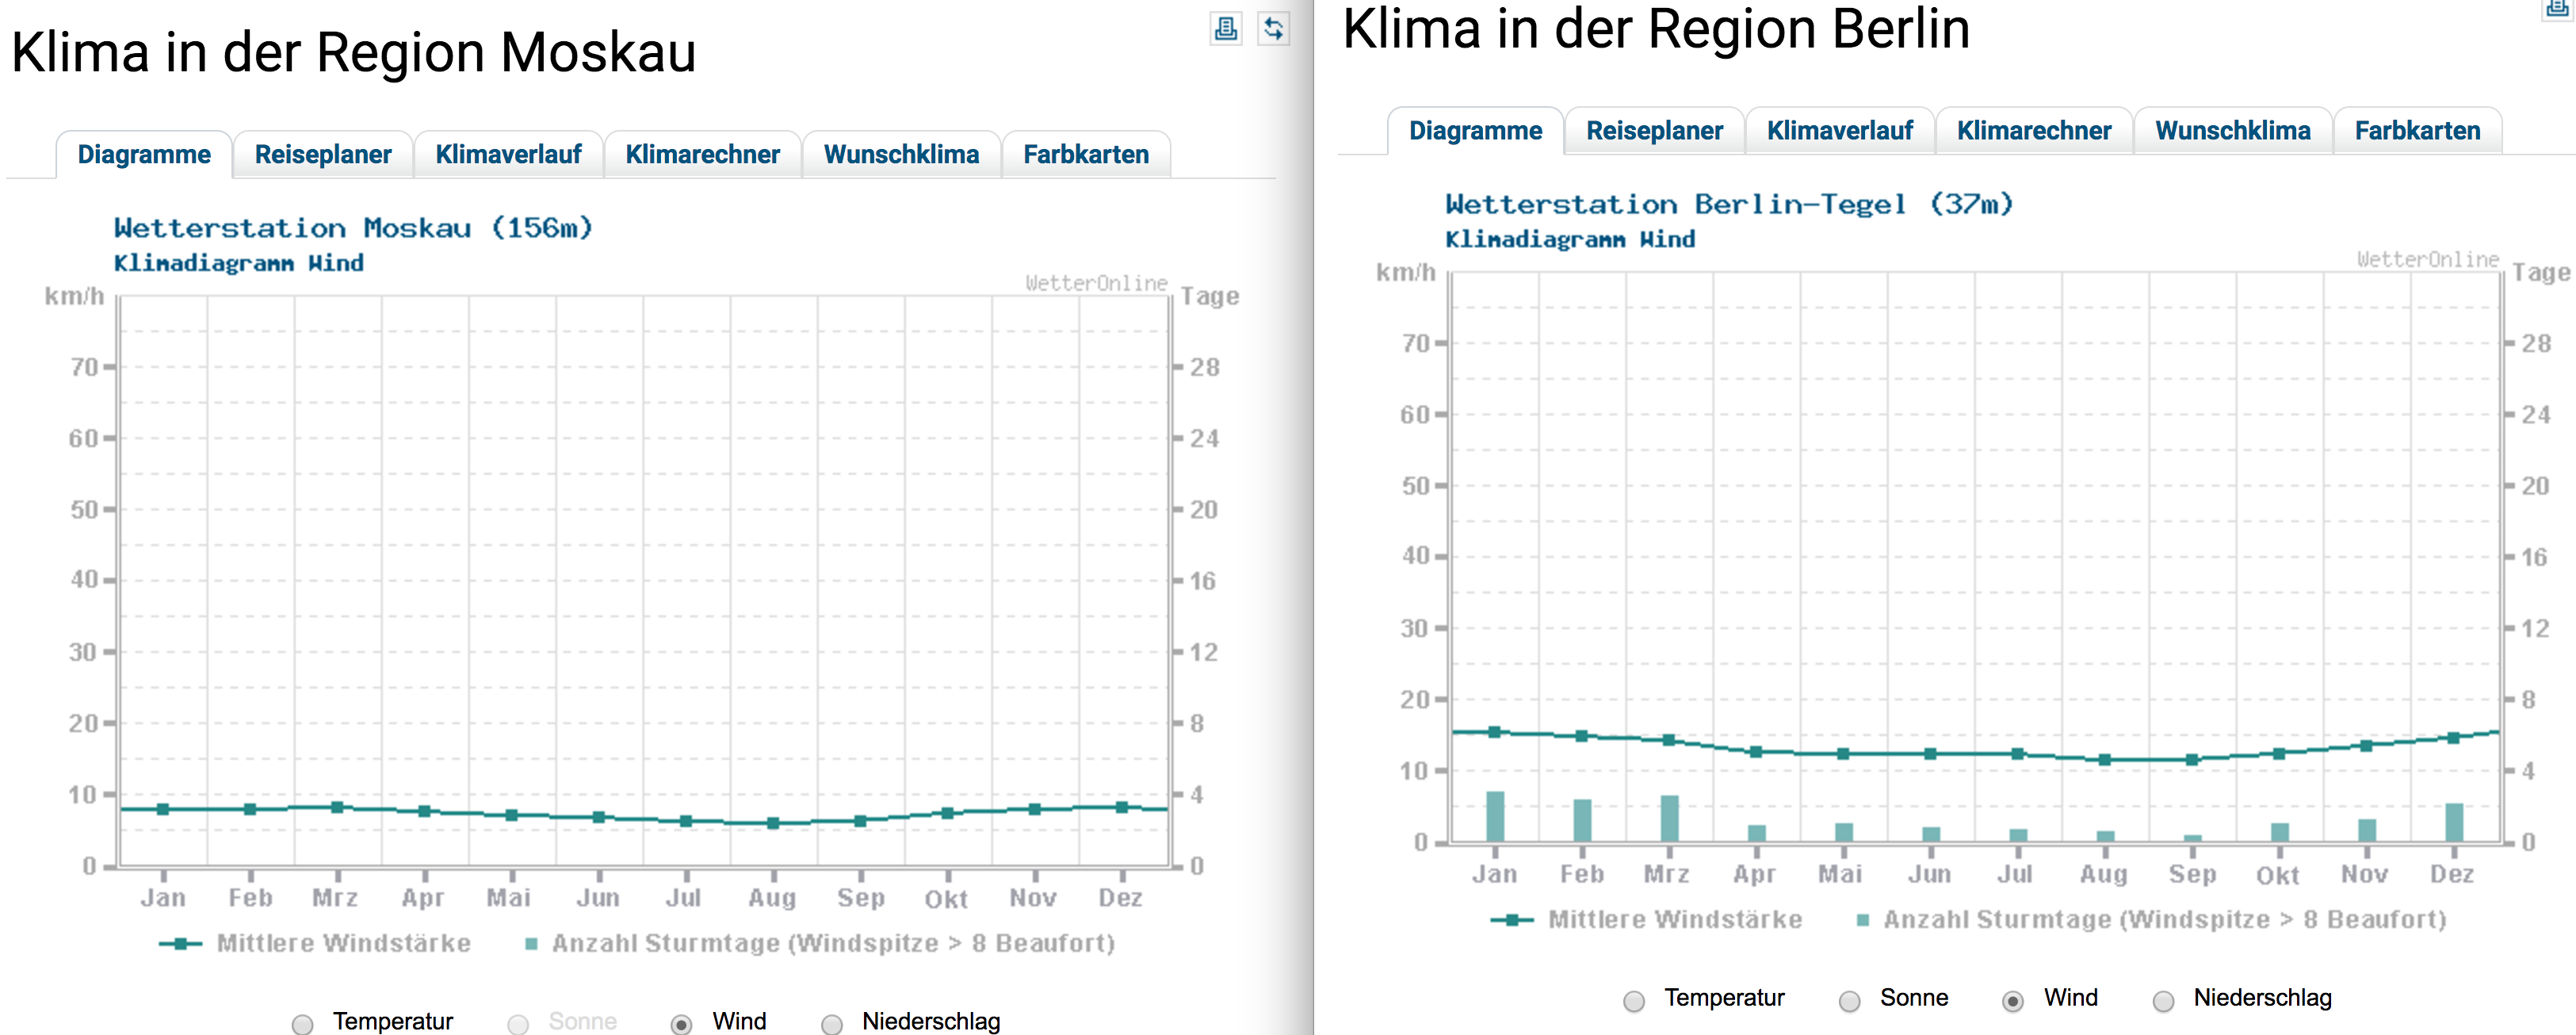
| "### ... Berlin is more windy:" | |
| ] | |
| }, | |
| { | |
| "cell_type": "markdown", | |
| "metadata": { | |
| "collapsed": false | |
| }, | |
| "source": [ | |
| "" | |
| ] | |
| }, | |
| { | |
| "cell_type": "markdown", | |
| "metadata": {}, | |
| "source": [ | |
| "I was convinced that this little presentation would be enough for every sane person to accept that Moscow's summer is not really a lot more hotter than Berlin's (only less windy).\n", | |
| "\n", | |
| "My wife wasn't really happy, though. She replied, that she doesn't know where the statistics come from and what period this is. In fact I realized that I broke [one of the basics](https://medium.com/data-goodie/data-scientists-exercise-with-their-own-ideas-on-real-datasets-basics-for-starting-out-with-them-c7d4dad98f4b) when starting out with any statistic or data: Expressiveness. I was not sure which period of time those graphs covered and it's not stated there either. I just said some years... But was it the same amount of time? And who cares about 150 year old data anyway? Also 200 years ago part of Western Europe experienced a minor Ice Age (https://en.wikipedia.org/wiki/Little_Ice_Age), is that taken in the account of Berlin too :D ? So I decided to make my own statistics for some relevant period of time. Firstly, I would take the data from the last 25 years to show the hypothesis' general fallacy. And secondly, examine closely the periods when Mrs. Steinmetz lived in Moscow and when she moved to Berlin to check if there might be some evidence for a little bias.\n", | |
| "\n", | |
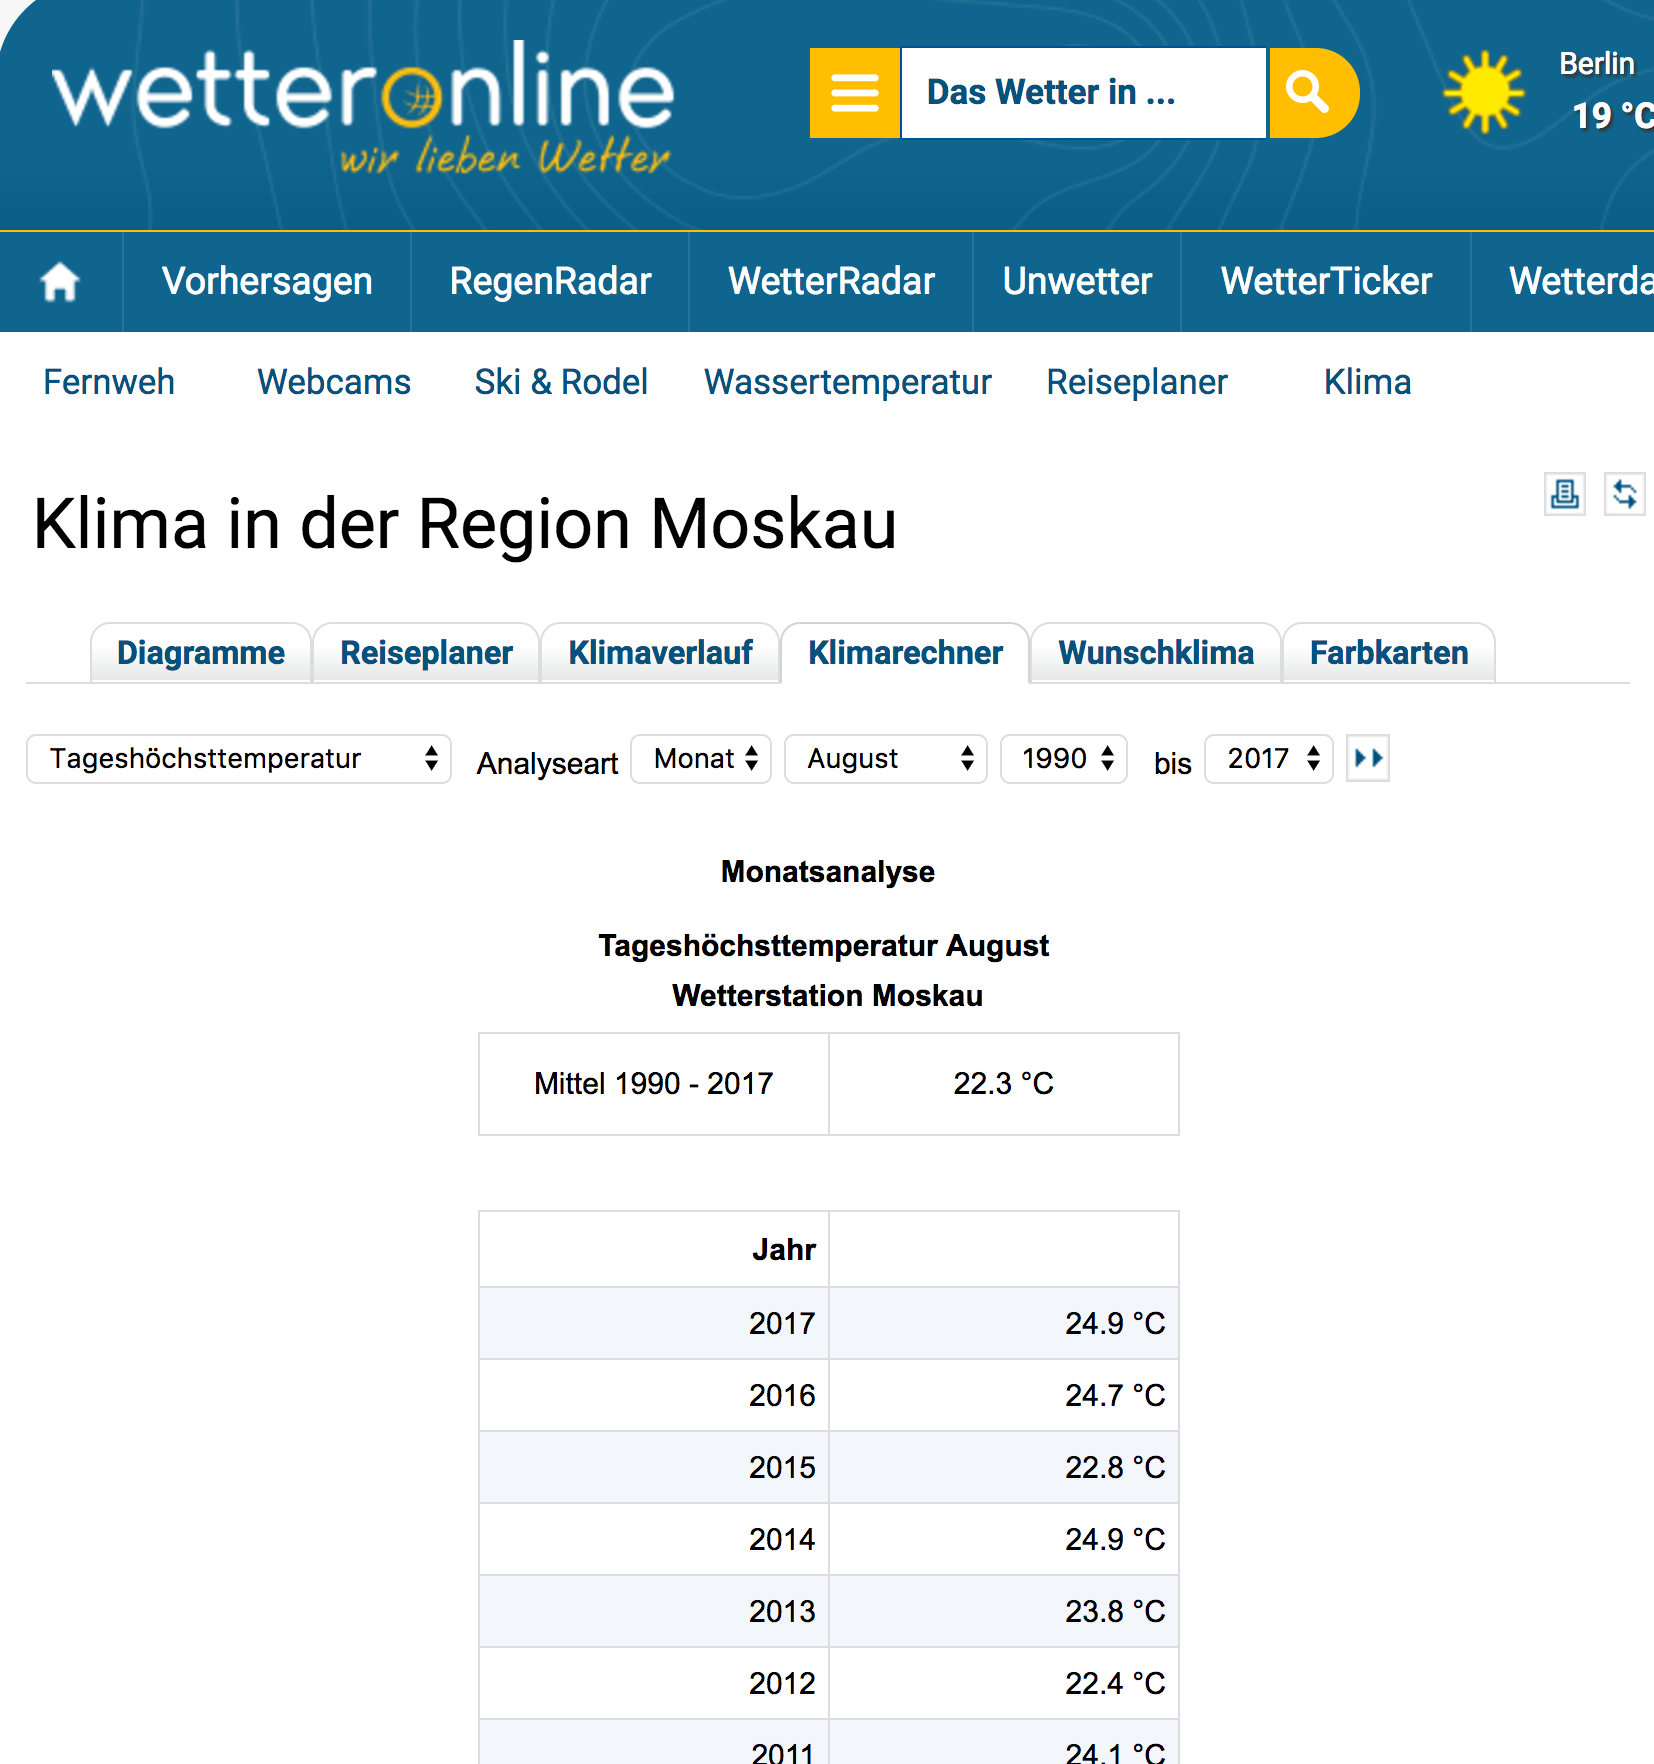
| "# Weather data\n", | |
| "Getting some historical weather data of Moscow and Berlin wasn't as a funny walk as I thought it would be.\n", | |
| "I found the raw datasets to be super cryptic and the explanatory codebooks non-existent or non-sense. When I found some really good looking data on www.wetteronline.de I was very happy as it seemed to be a doable task to get it with a few scraping tricks using python. The data is nicely organzed in tables and the URLs give readable information [(link)](http://www.wetteronline.de/?pcid=pc_rueckblick_climate&gid=10382&iid=10382&pid=p_rueckblick_climatecalculator&sid=Default&var=TX&analysis=monthly&month=08&startyear=1990&endyear=2017&iid=10382):" | |
| ] | |
| }, | |
| { | |
| "cell_type": "markdown", | |
| "metadata": { | |
| "collapsed": false | |
| }, | |
| "source": [ | |
| "" | |
| ] | |
| }, | |
| { | |
| "cell_type": "markdown", | |
| "metadata": { | |
| "collapsed": true | |
| }, | |
| "source": [ | |
| "# Getting the Data - Scrape it out\n", | |
| "Scrape sounds very cruel. But actually the process of web scraping having some programming experience isn't that bad.\n", | |
| "\n", | |
| "I outlined the following plan to reach my goal:\n", | |
| "\n", | |
| "Print all weather data of the www.wetteronline.de page for Moscow and Berlin. (7 categories [like highest average temperature etc.] for every month from 01.1990 to 07.2017)\n", | |
| "<br> \n", | |
| "<br>\n", | |
| "Next tutorials will then be about putting the data into a database, analyzing/comparing/visualizing it and finally we might touch on some machine learning to see if we get any fancy predictions of weather based on historical data.\n", | |
| "\n", | |
| "<br>\n", | |
| "<i> [To be able to follow this tutorial on your own, you will have to install python(3.x), IPython, jupyter and later we have to add some other libraries (I recommend to download [anaconda](https://www.continuum.io/downloads), then you'll have all bundled up and the setup of other libraries will be just one line of code). This guide is really step by step, how I approached the problem from Zero to Goal. Let me know if there are any problems with the code or anything else. ]</i>\n", | |
| "<br>\n", | |
| "<br>\n", | |
| "<i>(to navigate between the cells, click on a cell once and do follow with SHIFT+ENTER on your keyboard)</i>\n", | |
| "<br>" | |
| ] | |
| }, | |
| { | |
| "cell_type": "markdown", | |
| "metadata": {}, | |
| "source": [ | |
| "# - I. - \n", | |
| "Task 1: Print out Moscow's average highest temperature for August for all years between 1990 and 2017 with the data gathered from the website." | |
| ] | |
| }, | |
| { | |
| "cell_type": "code", | |
| "execution_count": 24, | |
| "metadata": { | |
| "collapsed": false | |
| }, | |
| "outputs": [], | |
| "source": [ | |
| "# Libraries\n", | |
| "# I already knew where to begin thanks to my Professor Zhang, who was brave enough\n", | |
| "# to start out our computer science course with some nice practical scraping.\n", | |
| "from urllib.request import Request, urlopen\n", | |
| "from bs4 import BeautifulSoup as bs\n", | |
| "# if you don't have BeautifulSoup installed yet, you would need \n", | |
| "# to execute do in your own command line: \n", | |
| "# pip install beautifulsoup4" | |
| ] | |
| }, | |
| { | |
| "cell_type": "code", | |
| "execution_count": 25, | |
| "metadata": { | |
| "collapsed": false | |
| }, | |
| "outputs": [], | |
| "source": [ | |
| "# declare variables and load page\n", | |
| "req = Request('http://www.wetteronline.de/?pcid=pc_rueckblick_climate&gid=27612&iid=27612&pid=p_rueckblick_climatecalculator&sid=Default&var=TX&analysis=monthly&month=08&startyear=1990&endyear=2017&iid=27612', headers={'User-Agent': 'Mozilla/5.0'})\n", | |
| "webpage = urlopen(req).read()" | |
| ] | |
| }, | |
| { | |
| "cell_type": "markdown", | |
| "metadata": {}, | |
| "source": [ | |
| "By the way my first approach failed with the error\n", | |
| "<br>\n", | |
| " <b>\"HTTPError: HTTP Error 403: Forbidden\"</b>\n", | |
| "<br>\n", | |
| "The solution was to put the header as the last parameter of the Request() object so that our request wouldn't be classified as some evil robotic force crawling the website." | |
| ] | |
| }, | |
| { | |
| "cell_type": "markdown", | |
| "metadata": { | |
| "collapsed": true | |
| }, | |
| "source": [ | |
| "The second approach with the header passed to the Request was then more successful with this Beautiful Output:" | |
| ] | |
| }, | |
| { | |
| "cell_type": "code", | |
| "execution_count": 32, | |
| "metadata": { | |
| "collapsed": false | |
| }, | |
| "outputs": [], | |
| "source": [ | |
| "# print(webpage)\n", | |
| "# I put the foto instead of the real output for you not to scroll endlessly\n", | |
| "# if you are viewing the notebook on Github instead of the Jupyter notebook." | |
| ] | |
| }, | |
| { | |
| "cell_type": "markdown", | |
| "metadata": {}, | |
| "source": [ | |
| "" | |
| ] | |
| }, | |
| { | |
| "cell_type": "markdown", | |
| "metadata": {}, | |
| "source": [ | |
| "### Make a soup out of it\n", | |
| "But you can make this output even more precious. The beautifulsoup library is very popular to convert ugly things in nice readable structures. As you can see at the beginning of the output above, it starts with some <b>b'</b>. That is a sign for the fact that it is a byte string which has to be decoded first:" | |
| ] | |
| }, | |
| { | |
| "cell_type": "code", | |
| "execution_count": 27, | |
| "metadata": { | |
| "collapsed": false | |
| }, | |
| "outputs": [], | |
| "source": [ | |
| "webpage = webpage.decode('utf-8')" | |
| ] | |
| }, | |
| { | |
| "cell_type": "markdown", | |
| "metadata": {}, | |
| "source": [ | |
| "Now you are ready to really make it a readable output using the prettify() method on our soup:" | |
| ] | |
| }, | |
| { | |
| "cell_type": "code", | |
| "execution_count": 38, | |
| "metadata": { | |
| "collapsed": false, | |
| "scrolled": true | |
| }, | |
| "outputs": [], | |
| "source": [ | |
| "soup = bs(webpage, 'html.parser')\n", | |
| "# print(soup.prettify())" | |
| ] | |
| }, | |
| { | |
| "cell_type": "markdown", | |
| "metadata": {}, | |
| "source": [ | |
| "" | |
| ] | |
| }, | |
| { | |
| "cell_type": "markdown", | |
| "metadata": {}, | |
| "source": [ | |
| "But the beautifying of the HTML stream is not our final goal of course. The prettified output is just nice to have when you run your methods against the soup. For instance to find out which part of your HTML you targeted with a find(tag) method and which tag to target next to get the desired data. Firstly, however, I would analyze the HTML structure in Chrome's Developer Tool's and make a plan how to access my table elements (the years and the according values). Initially, I found out that the whole table is inside a TABLE tag with the ID 'climatecalculator_result'. With our `soup` object, we now can easily access any element of the DOM with methods like find() by searching for some attribute or anything else:" | |
| ] | |
| }, | |
| { | |
| "cell_type": "code", | |
| "execution_count": 39, | |
| "metadata": { | |
| "collapsed": false | |
| }, | |
| "outputs": [ | |
| { | |
| "name": "stdout", | |
| "output_type": "stream", | |
| "text": [ | |
| "<table id=\"climatecalculator_result\">\n", | |
| " <thead>\n", | |
| " <tr class=\"headline\">\n", | |
| " <th colspan=\"2\">\n", | |
| " Monatsanalyse\n", | |
| " </th>\n", | |
| " </tr>\n", | |
| " <tr class=\"headline\">\n", | |
| " <th colspan=\"2\">\n", | |
| " Windstärke Dezember\n", | |
| " <br/>\n", | |
| " Wetterstation Berlin-Tegel\n", | |
| " </th>\n", | |
| " </tr>\n", | |
| " <tr class=\"mean\">\n", | |
| " <th>\n", | |
| " Mittel 1990 - 2017\n", | |
| " </th>\n", | |
| " <th>\n", | |
| " 14.7 km/h\n", | |
| " </th>\n", | |
| " </tr>\n", | |
| " <tr class=\"divide\">\n", | |
| " <th colspan=\"2\">\n", | |
| " </th>\n", | |
| " </tr>\n", | |
| " <tr class=\"detailhead\">\n", | |
| " <th>\n", | |
| " Jahr\n", | |
| " </th>\n", | |
| " <th>\n", | |
| " </th>\n", | |
| " </tr>\n", | |
| " </thead>\n", | |
| " <tbody>\n", | |
| " <tr>\n", | |
| " <td>\n", | |
| " 2017\n", | |
| " </td>\n", | |
| " <td>\n", | |
| " - km/h\n", | |
| " </td>\n", | |
| " </tr>\n", | |
| " <tr class=\"odd\">\n", | |
| " <td>\n", | |
| " 2016\n", | |
| " </td>\n", | |
| " <td>\n", | |
| " 14.0 km/h\n", | |
| " </td>\n", | |
| " </tr>\n", | |
| " <tr>\n", | |
| " <td>\n", | |
| " 2015\n", | |
| " </td>\n", | |
| " <td>\n", | |
| " 16.6 km/h\n", | |
| " </td>\n", | |
| " </tr>\n", | |
| " <tr class=\"odd\">\n", | |
| " <td>\n", | |
| " 2014\n", | |
| " </td>\n", | |
| " <td>\n", | |
| " 16.6 km/h\n", | |
| " </td>\n", | |
| " </tr>\n", | |
| " <tr>\n", | |
| " <td>\n", | |
| " 2013\n", | |
| " </td>\n", | |
| " <td>\n", | |
| " 14.9 km/h\n", | |
| " </td>\n", | |
| " </tr>\n", | |
| " <tr class=\"odd\">\n", | |
| " <td>\n", | |
| " 2012\n", | |
| " </td>\n", | |
| " <td>\n", | |
| " 12.9 km/h\n", | |
| " </td>\n", | |
| " </tr>\n", | |
| " <tr>\n", | |
| " <td>\n", | |
| " 2011\n", | |
| " </td>\n", | |
| " <td>\n", | |
| " 19.5 km/h\n", | |
| " </td>\n", | |
| " </tr>\n", | |
| " <tr class=\"odd\">\n", | |
| " <td>\n", | |
| " 2010\n", | |
| " </td>\n", | |
| " <td>\n", | |
| " 12.2 km/h\n", | |
| " </td>\n", | |
| " </tr>\n", | |
| " <tr>\n", | |
| " <td>\n", | |
| " 2009\n", | |
| " </td>\n", | |
| " <td>\n", | |
| " 11.2 km/h\n", | |
| " </td>\n", | |
| " </tr>\n", | |
| " <tr class=\"odd\">\n", | |
| " <td>\n", | |
| " 2008\n", | |
| " </td>\n", | |
| " <td>\n", | |
| " 11.8 km/h\n", | |
| " </td>\n", | |
| " </tr>\n", | |
| " <tr>\n", | |
| " <td>\n", | |
| " 2007\n", | |
| " </td>\n", | |
| " <td>\n", | |
| " 13.4 km/h\n", | |
| " </td>\n", | |
| " </tr>\n", | |
| " <tr class=\"odd\">\n", | |
| " <td>\n", | |
| " 2006\n", | |
| " </td>\n", | |
| " <td>\n", | |
| " 14.8 km/h\n", | |
| " </td>\n", | |
| " </tr>\n", | |
| " <tr>\n", | |
| " <td>\n", | |
| " 2005\n", | |
| " </td>\n", | |
| " <td>\n", | |
| " 13.8 km/h\n", | |
| " </td>\n", | |
| " </tr>\n", | |
| " <tr class=\"odd\">\n", | |
| " <td>\n", | |
| " 2004\n", | |
| " </td>\n", | |
| " <td>\n", | |
| " 13.8 km/h\n", | |
| " </td>\n", | |
| " </tr>\n", | |
| " <tr>\n", | |
| " <td>\n", | |
| " 2003\n", | |
| " </td>\n", | |
| " <td>\n", | |
| " 15.4 km/h\n", | |
| " </td>\n", | |
| " </tr>\n", | |
| " <tr class=\"odd\">\n", | |
| " <td>\n", | |
| " 2002\n", | |
| " </td>\n", | |
| " <td>\n", | |
| " 13.5 km/h\n", | |
| " </td>\n", | |
| " </tr>\n", | |
| " <tr>\n", | |
| " <td>\n", | |
| " 2001\n", | |
| " </td>\n", | |
| " <td>\n", | |
| " 15.3 km/h\n", | |
| " </td>\n", | |
| " </tr>\n", | |
| " <tr class=\"odd\">\n", | |
| " <td>\n", | |
| " 2000\n", | |
| " </td>\n", | |
| " <td>\n", | |
| " 13.3 km/h\n", | |
| " </td>\n", | |
| " </tr>\n", | |
| " <tr>\n", | |
| " <td>\n", | |
| " 1999\n", | |
| " </td>\n", | |
| " <td>\n", | |
| " 19.9 km/h\n", | |
| " </td>\n", | |
| " </tr>\n", | |
| " <tr class=\"odd\">\n", | |
| " <td>\n", | |
| " 1998\n", | |
| " </td>\n", | |
| " <td>\n", | |
| " 15.7 km/h\n", | |
| " </td>\n", | |
| " </tr>\n", | |
| " <tr>\n", | |
| " <td>\n", | |
| " 1997\n", | |
| " </td>\n", | |
| " <td>\n", | |
| " 14.1 km/h\n", | |
| " </td>\n", | |
| " </tr>\n", | |
| " <tr class=\"odd\">\n", | |
| " <td>\n", | |
| " 1996\n", | |
| " </td>\n", | |
| " <td>\n", | |
| " 10.5 km/h\n", | |
| " </td>\n", | |
| " </tr>\n", | |
| " <tr>\n", | |
| " <td>\n", | |
| " 1995\n", | |
| " </td>\n", | |
| " <td>\n", | |
| " 11.5 km/h\n", | |
| " </td>\n", | |
| " </tr>\n", | |
| " <tr class=\"odd\">\n", | |
| " <td>\n", | |
| " 1994\n", | |
| " </td>\n", | |
| " <td>\n", | |
| " 16.0 km/h\n", | |
| " </td>\n", | |
| " </tr>\n", | |
| " <tr>\n", | |
| " <td>\n", | |
| " 1993\n", | |
| " </td>\n", | |
| " <td>\n", | |
| " 20.8 km/h\n", | |
| " </td>\n", | |
| " </tr>\n", | |
| " <tr class=\"odd\">\n", | |
| " <td>\n", | |
| " 1992\n", | |
| " </td>\n", | |
| " <td>\n", | |
| " 13.6 km/h\n", | |
| " </td>\n", | |
| " </tr>\n", | |
| " <tr>\n", | |
| " <td>\n", | |
| " 1991\n", | |
| " </td>\n", | |
| " <td>\n", | |
| " 16.3 km/h\n", | |
| " </td>\n", | |
| " </tr>\n", | |
| " <tr class=\"odd\">\n", | |
| " <td>\n", | |
| " 1990\n", | |
| " </td>\n", | |
| " <td>\n", | |
| " 15.3 km/h\n", | |
| " </td>\n", | |
| " </tr>\n", | |
| " </tbody>\n", | |
| "</table>\n", | |
| "\n" | |
| ] | |
| } | |
| ], | |
| "source": [ | |
| "climate_frame = soup.find(id='climatecalculator_result')\n", | |
| "print(climate_frame.prettify())" | |
| ] | |
| }, | |
| { | |
| "cell_type": "markdown", | |
| "metadata": { | |
| "collapsed": true | |
| }, | |
| "source": [ | |
| "Now we have a structure, that we hopefully can work with. So far it looks like the algorithm could be something like \n", | |
| "<code>\n", | |
| "> To your own database:\n", | |
| "> For every row <tr> put the first <td> in column 'year' and the second <td> in column 'highest_temp'\n", | |
| "</code>\n", | |
| "<br>\n", | |
| "After a bit of playing with some simple for loops we can deduct those two simple loops and get the data achieved with the beautifulsoup library again:" | |
| ] | |
| }, | |
| { | |
| "cell_type": "code", | |
| "execution_count": 30, | |
| "metadata": { | |
| "collapsed": false, | |
| "scrolled": true | |
| }, | |
| "outputs": [ | |
| { | |
| "name": "stdout", | |
| "output_type": "stream", | |
| "text": [ | |
| "2017\n", | |
| "25.4 °C\n", | |
| "2016\n", | |
| "24.7 °C\n", | |
| "2015\n", | |
| "22.8 °C\n", | |
| "2014\n", | |
| "24.9 °C\n", | |
| "2013\n", | |
| "23.8 °C\n", | |
| "2012\n", | |
| "22.4 °C\n", | |
| "2011\n", | |
| "24.1 °C\n", | |
| "2010\n", | |
| "27.3 °C\n", | |
| "2009\n", | |
| "20.2 °C\n", | |
| "2008\n", | |
| "21.7 °C\n", | |
| "2007\n", | |
| "25.7 °C\n", | |
| "2006\n", | |
| "21.7 °C\n", | |
| "2005\n", | |
| "23.1 °C\n", | |
| "2004\n", | |
| "23.6 °C\n", | |
| "2003\n", | |
| "21.2 °C\n", | |
| "2002\n", | |
| "22.7 °C\n", | |
| "2001\n", | |
| "21.6 °C\n", | |
| "2000\n", | |
| "21.3 °C\n", | |
| "1999\n", | |
| "21.2 °C\n", | |
| "1998\n", | |
| "19.3 °C\n", | |
| "1997\n", | |
| "22.1 °C\n", | |
| "1996\n", | |
| "- °C\n", | |
| "1995\n", | |
| "21.1 °C\n", | |
| "1994\n", | |
| "19.6 °C\n", | |
| "1993\n", | |
| "19.2 °C\n", | |
| "1992\n", | |
| "22.4 °C\n", | |
| "1991\n", | |
| "19.9 °C\n", | |
| "1990\n", | |
| "19.8 °C\n" | |
| ] | |
| } | |
| ], | |
| "source": [ | |
| "table = climate_frame.tbody # you can access child elements just by using the dot notation\n", | |
| "for row in table.findAll('tr'):\n", | |
| " for td in row.find_all('td'):\n", | |
| " print(td.get_text())" | |
| ] | |
| }, | |
| { | |
| "cell_type": "markdown", | |
| "metadata": { | |
| "collapsed": true | |
| }, | |
| "source": [ | |
| "<i>A little side note on legal stuff: when I familiarized myself with web\n", | |
| "scraping (here: https://www.dataquest.io/blog/web-scraping-tutorial-python/), I stumbled over the fact that actually I could theoretically just use the API without scraping anything, but 'luckily' www.wetteronline.de doesn't have an API for historical data :)Funny enough, the dataquest tutorial also uses a weather page for scraping. Another important point here: dataquest uses CURRENT weather data to scrape. This could be problematic with www.wetteronline.de's current/forecasting weather data because they sell this weather data API, so this could be subject to copyright. So keep in mind to stay in conformity with the law especially if you go public with your results (a little intro: http://blog.icreon.us/advise/web-scraping-legality) </i>" | |
| ] | |
| }, | |
| { | |
| "cell_type": "markdown", | |
| "metadata": {}, | |
| "source": [ | |
| "The data above looks good to me now. It should be really easy to put it all in separate columns in a database.\n", | |
| "\n", | |
| "But first we want *all data* for *all months* for *all categories*.\n", | |
| "To do so, we first need to examine the URL more closely:\n", | |
| "http://www.wetteronline.de/?pcid=pc_rueckblick_climate&gid=27612&iid=27612&pid=p_rueckblick_climatecalculator&sid=Default&var=TX&analysis=monthly&month=08&startyear=1990&endyear=2017&iid=27612\n", | |
| "\n", | |
| "Let's see how to divide this long peace of art into some readable chunks:\n", | |
| "<br>\n", | |
| "http://www.wetteronline.de/ \n", | |
| "<br>\n", | |
| "?\n", | |
| "<br>\n", | |
| "pcid=pc_rueckblick_climate\n", | |
| "<br>\n", | |
| "&\n", | |
| "<br>\n", | |
| "gid=27612\n", | |
| "<br>\n", | |
| "&\n", | |
| "<br>\n", | |
| "iid=27612\n", | |
| "<br>\n", | |
| "&\n", | |
| "<br>\n", | |
| "pid=p_rueckblick_climatecalculator\n", | |
| "<br>\n", | |
| "&\n", | |
| "<br>\n", | |
| "sid=Default\n", | |
| "<br>\n", | |
| "&\n", | |
| "<br>\n", | |
| "var=TX\n", | |
| "<br>\n", | |
| "&\n", | |
| "<br>\n", | |
| "analysis=monthly\n", | |
| "<br>\n", | |
| "&\n", | |
| "<br>\n", | |
| "month=08\n", | |
| "<br>\n", | |
| "&\n", | |
| "<br>\n", | |
| "startyear=1990\n", | |
| "<br>\n", | |
| "&\n", | |
| "<br>\n", | |
| "endyear=2017\n", | |
| "<br>\n", | |
| "&\n", | |
| "<br>\n", | |
| "iid=27612\n", | |
| "<br>" | |
| ] | |
| }, | |
| { | |
| "cell_type": "markdown", | |
| "metadata": { | |
| "collapsed": true | |
| }, | |
| "source": [ | |
| "If we play around with the form at http://www.wetteronline.de/klimarechner/berlin, we can quickly figure out that to get ALL data we have to change var=TX for the according category codes and month=08. But before I apply my theories to a real database, I like to verify them with some plain print outs. This would also be the final code for the whole scraping exercise:" | |
| ] | |
| }, | |
| { | |
| "cell_type": "code", | |
| "execution_count": 31, | |
| "metadata": { | |
| "collapsed": false, | |
| "scrolled": true | |
| }, | |
| "outputs": [ | |
| { | |
| "name": "stdout", | |
| "output_type": "stream", | |
| "text": [ | |
| "this is just a little part of the whole output \n", | |
| " comment out the if parts of the code to have the full outprint\n", | |
| "\n", | |
| "Category Month\n", | |
| "TX 01\n", | |
| "\n", | |
| "2017\n", | |
| "1.3 °C\n", | |
| "2016\n", | |
| "2.2 °C\n", | |
| "2015\n", | |
| "5.0 °C\n", | |
| "2014\n", | |
| "2.9 °C\n", | |
| "2013\n", | |
| "1.9 °C\n", | |
| "2012\n", | |
| "4.0 °C\n", | |
| "2011\n", | |
| "3.5 °C\n", | |
| "2010\n", | |
| "-3.1 °C\n", | |
| "2009\n", | |
| "0.7 °C\n", | |
| "2008\n", | |
| "6.2 °C\n", | |
| "2007\n", | |
| "7.6 °C\n", | |
| "2006\n", | |
| "-0.6 °C\n", | |
| "2005\n", | |
| "5.2 °C\n", | |
| "2004\n", | |
| "1.2 °C\n", | |
| "2003\n", | |
| "2.2 °C\n", | |
| "2002\n", | |
| "4.5 °C\n", | |
| "2001\n", | |
| "3.4 °C\n", | |
| "2000\n", | |
| "3.7 °C\n", | |
| "1999\n", | |
| "5.9 °C\n", | |
| "1998\n", | |
| "5.5 °C\n", | |
| "1997\n", | |
| "0.4 °C\n", | |
| "1996\n", | |
| "-1.9 °C\n", | |
| "1995\n", | |
| "2.9 °C\n", | |
| "1994\n", | |
| "5.3 °C\n", | |
| "1993\n", | |
| "4.9 °C\n", | |
| "1992\n", | |
| "3.3 °C\n", | |
| "1991\n", | |
| "4.7 °C\n", | |
| "1990\n", | |
| "5.9 °C\n" | |
| ] | |
| } | |
| ], | |
| "source": [ | |
| "from urllib.request import Request, urlopen\n", | |
| "from bs4 import BeautifulSoup as bs\n", | |
| "\n", | |
| "months = ['01','02','03','04','05','06','07','08','09','10','11','12']\n", | |
| "categories = ['TX','TN','NS','FFkmh']\n", | |
| "\n", | |
| "print('this is just a little part of the whole output \\n comment out the if parts of the code to have the full outprint')\n", | |
| "\n", | |
| "for category in categories:\n", | |
| " for month in months:\n", | |
| " url = 'http://www.wetteronline.de/?pcid=pc_rueckblick_climate&gid=10382&iid=10382&pid=p_rueckblick_climatecalculator&sid=Default&var=' + category + '&analysis=monthly&month=' + month + '&startyear=1990&endyear=2017&iid=10382'\n", | |
| " req = Request(url,\n", | |
| " headers={'User-Agent': 'Mozilla/5.0'})\n", | |
| " webpage = urlopen(req).read()\n", | |
| " webpage = webpage.decode('utf-8')\n", | |
| " soup = bs(webpage, 'html.parser')\n", | |
| " table = soup.tbody\n", | |
| " if(category is 'TX' and month is '01'):\n", | |
| " print('\\nCategory Month\\n' + category + ' ' + month + '\\n')\n", | |
| " for row in table.findAll('tr'):\n", | |
| " for td in row.find_all(\"td\"):\n", | |
| " if(category is 'TX' and month is '01'):\n", | |
| " print(td.get_text())" | |
| ] | |
| }, | |
| { | |
| "cell_type": "markdown", | |
| "metadata": { | |
| "collapsed": true | |
| }, | |
| "source": [ | |
| "# Conclusion\n", | |
| "This is why I love Python: you can have a bunch of data in your pocket from a website with a few lines of code. \n", | |
| "Thanks for staying by! By now we have achieved scraping all average data of all categories for all months and all historical years down to 1990.\n", | |
| "\n", | |
| "# What's next?\n", | |
| "Next I will continue with setting up a database, push the data into it and start to compare and analyze it using different statistical approaches including data visualization. Any feedback is always welcome, especially to figure out how good this step by step format works for you folks." | |
| ] | |
| }, | |
| { | |
| "cell_type": "code", | |
| "execution_count": null, | |
| "metadata": { | |
| "collapsed": true | |
| }, | |
| "outputs": [], | |
| "source": [] | |
| } | |
| ], | |
| "metadata": { | |
| "kernelspec": { | |
| "display_name": "Python 3", | |
| "language": "python", | |
| "name": "python3" | |
| }, | |
| "language_info": { | |
| "codemirror_mode": { | |
| "name": "ipython", | |
| "version": 3 | |
| }, | |
| "file_extension": ".py", | |
| "mimetype": "text/x-python", | |
| "name": "python", | |
| "nbconvert_exporter": "python", | |
| "pygments_lexer": "ipython3", | |
| "version": "3.6.0" | |
| } | |
| }, | |
| "nbformat": 4, | |
| "nbformat_minor": 0 | |
| } |
Sign up for free
to join this conversation on GitHub.
Already have an account?
Sign in to comment